Testing a new “ET” to see if the Automation works.
Economic Trends
Job Openings and Labor Turnover (JOLTS)

The monthly JOLTS report, published by the Bureau of Labor Statistics, provides data on labor demand and turnover. The release is already two months old when it comes out, but this still important indicator gives us a pulse on the job market, even if it’s confirming rather than leading.
In this morning’s report for December, there were 11 million job openings, which was better than expected while hires and separations were little changed.
JOLTS CHART
While the job openings figure seems positive, the majority of these increases came from accommodation and food services (hospitality), retail, and construction and were in companies with less than 250 employees. Companies with more than 5,000 employees saw a decrease in openings.
Given these figures are not seasonally adjusted, we can surmise that many of the hospitality increases were due to the holiday surge.
ISM Manufacturing
The Institute for Supply Management (ISM) released their January report this morning. The index came in at 47.4%, down 1 from its December reading and worse than consensus. This is its third consecutive month of contraction and its lowest since May 2020. Here’s the latest from the press release:
“The U.S. manufacturing sector again contracted, with the Manufacturing PMI® at its lowest level since the coronavirus pandemic recovery began. With Business Survey Committee panelists reporting softening new order rates over the previous nine months, the January composite index reading reflects companies slowing outputs to better match demand in the first half of 2023 and prepare for growth in the second half of the year.
Personal Consumption Expenditure (PCE)
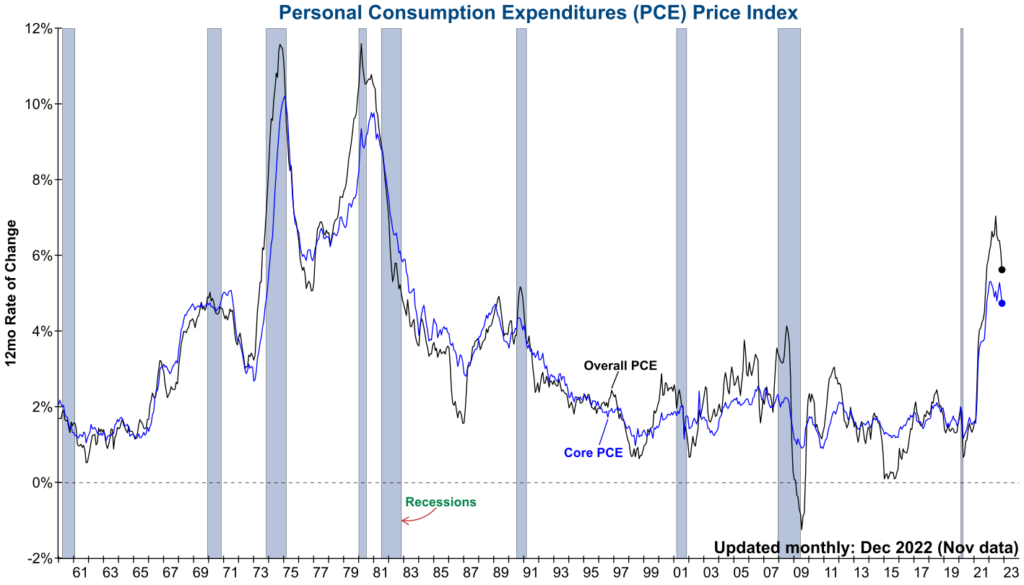
The Bureau of Economic Analysis releases PCE monthly. PCE is the most comprehensive measure of consumer spending and the largest component of GDP (about two-thirds!). It’s made up of goods and services – and it’s also the Fed’s preferred measure of inflation.
The latest figure for November Headline PCE came in at 5.5% YoY which was slightly lower than October’s figure. Core PCE for November was at 4.7%, which was as forecast.
Pending Home Sales Index
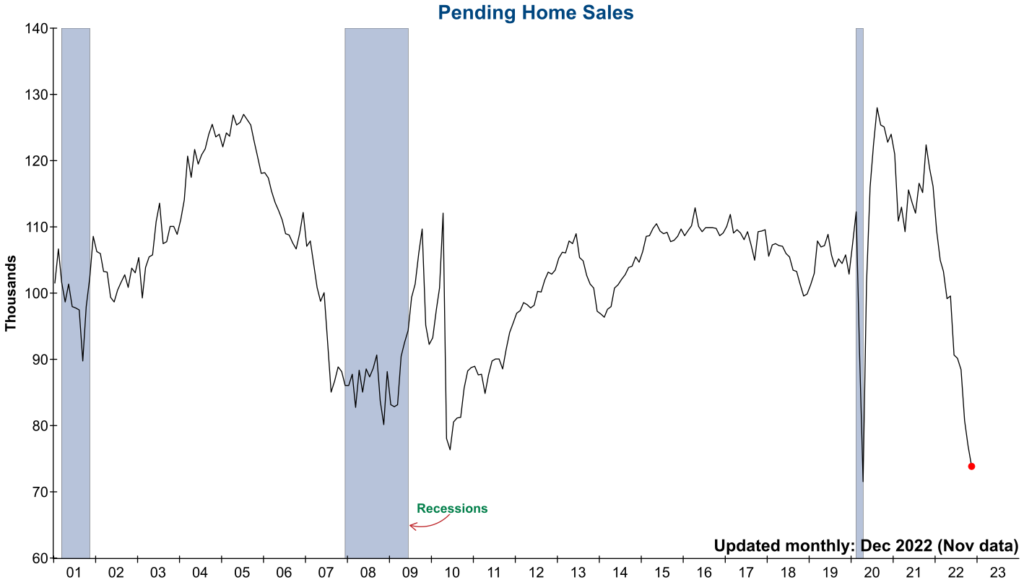
The National Association of Realtors (NAR)’s Pending Home Sales Index is a leading indicator for the housing sector based on pending sales of existing homes. A sale is pending if a contract has been signed, but the sale has not closed. Typically, these sales close within two months of a contract signing.
The latest Pending Home Sales Index came in at 73.9 for November, which was a 4% decline from October and worse than forecast. Here’s an excerpt from the latest press release:
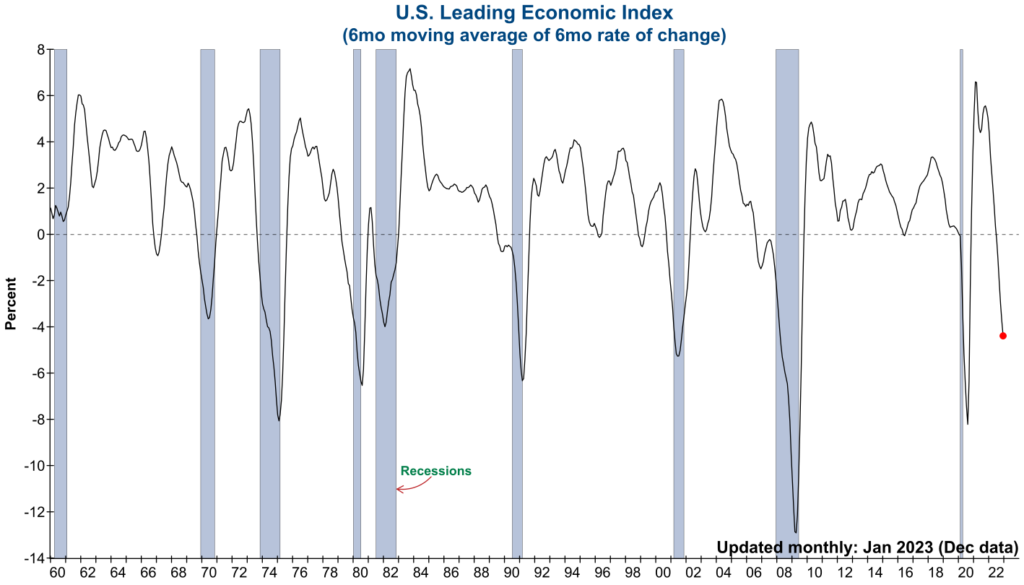
Conference Board Leading Economic Index (LEI)
The Conference Board’s LEI is a monthly index based on 10 components, both financial and non-financial, that anticipates turning points in the business cycle. The latest data for December came in at 110.5, a decrease of 1%. This represents its 10th consecutive decline and was worse than consensus forecast. Here’s the latest from the CB’s press release: